Nonprofit Insights Dashboard – Form 990 Data Aggregation
Turning complex nonprofit tax data into clear stories of impact and financial health.

Turning complex nonprofit tax data into clear stories of impact and financial health.
Nonprofits play vital roles in our communities, but their stories aren’t always easy to grasp just by reading through dense IRS filings. This project set out to change that by transforming intricate tax return data from recent IRS Form 990 XML files into a dynamic, user-friendly dashboard that tells the full story of a nonprofit’s financial health and impact.
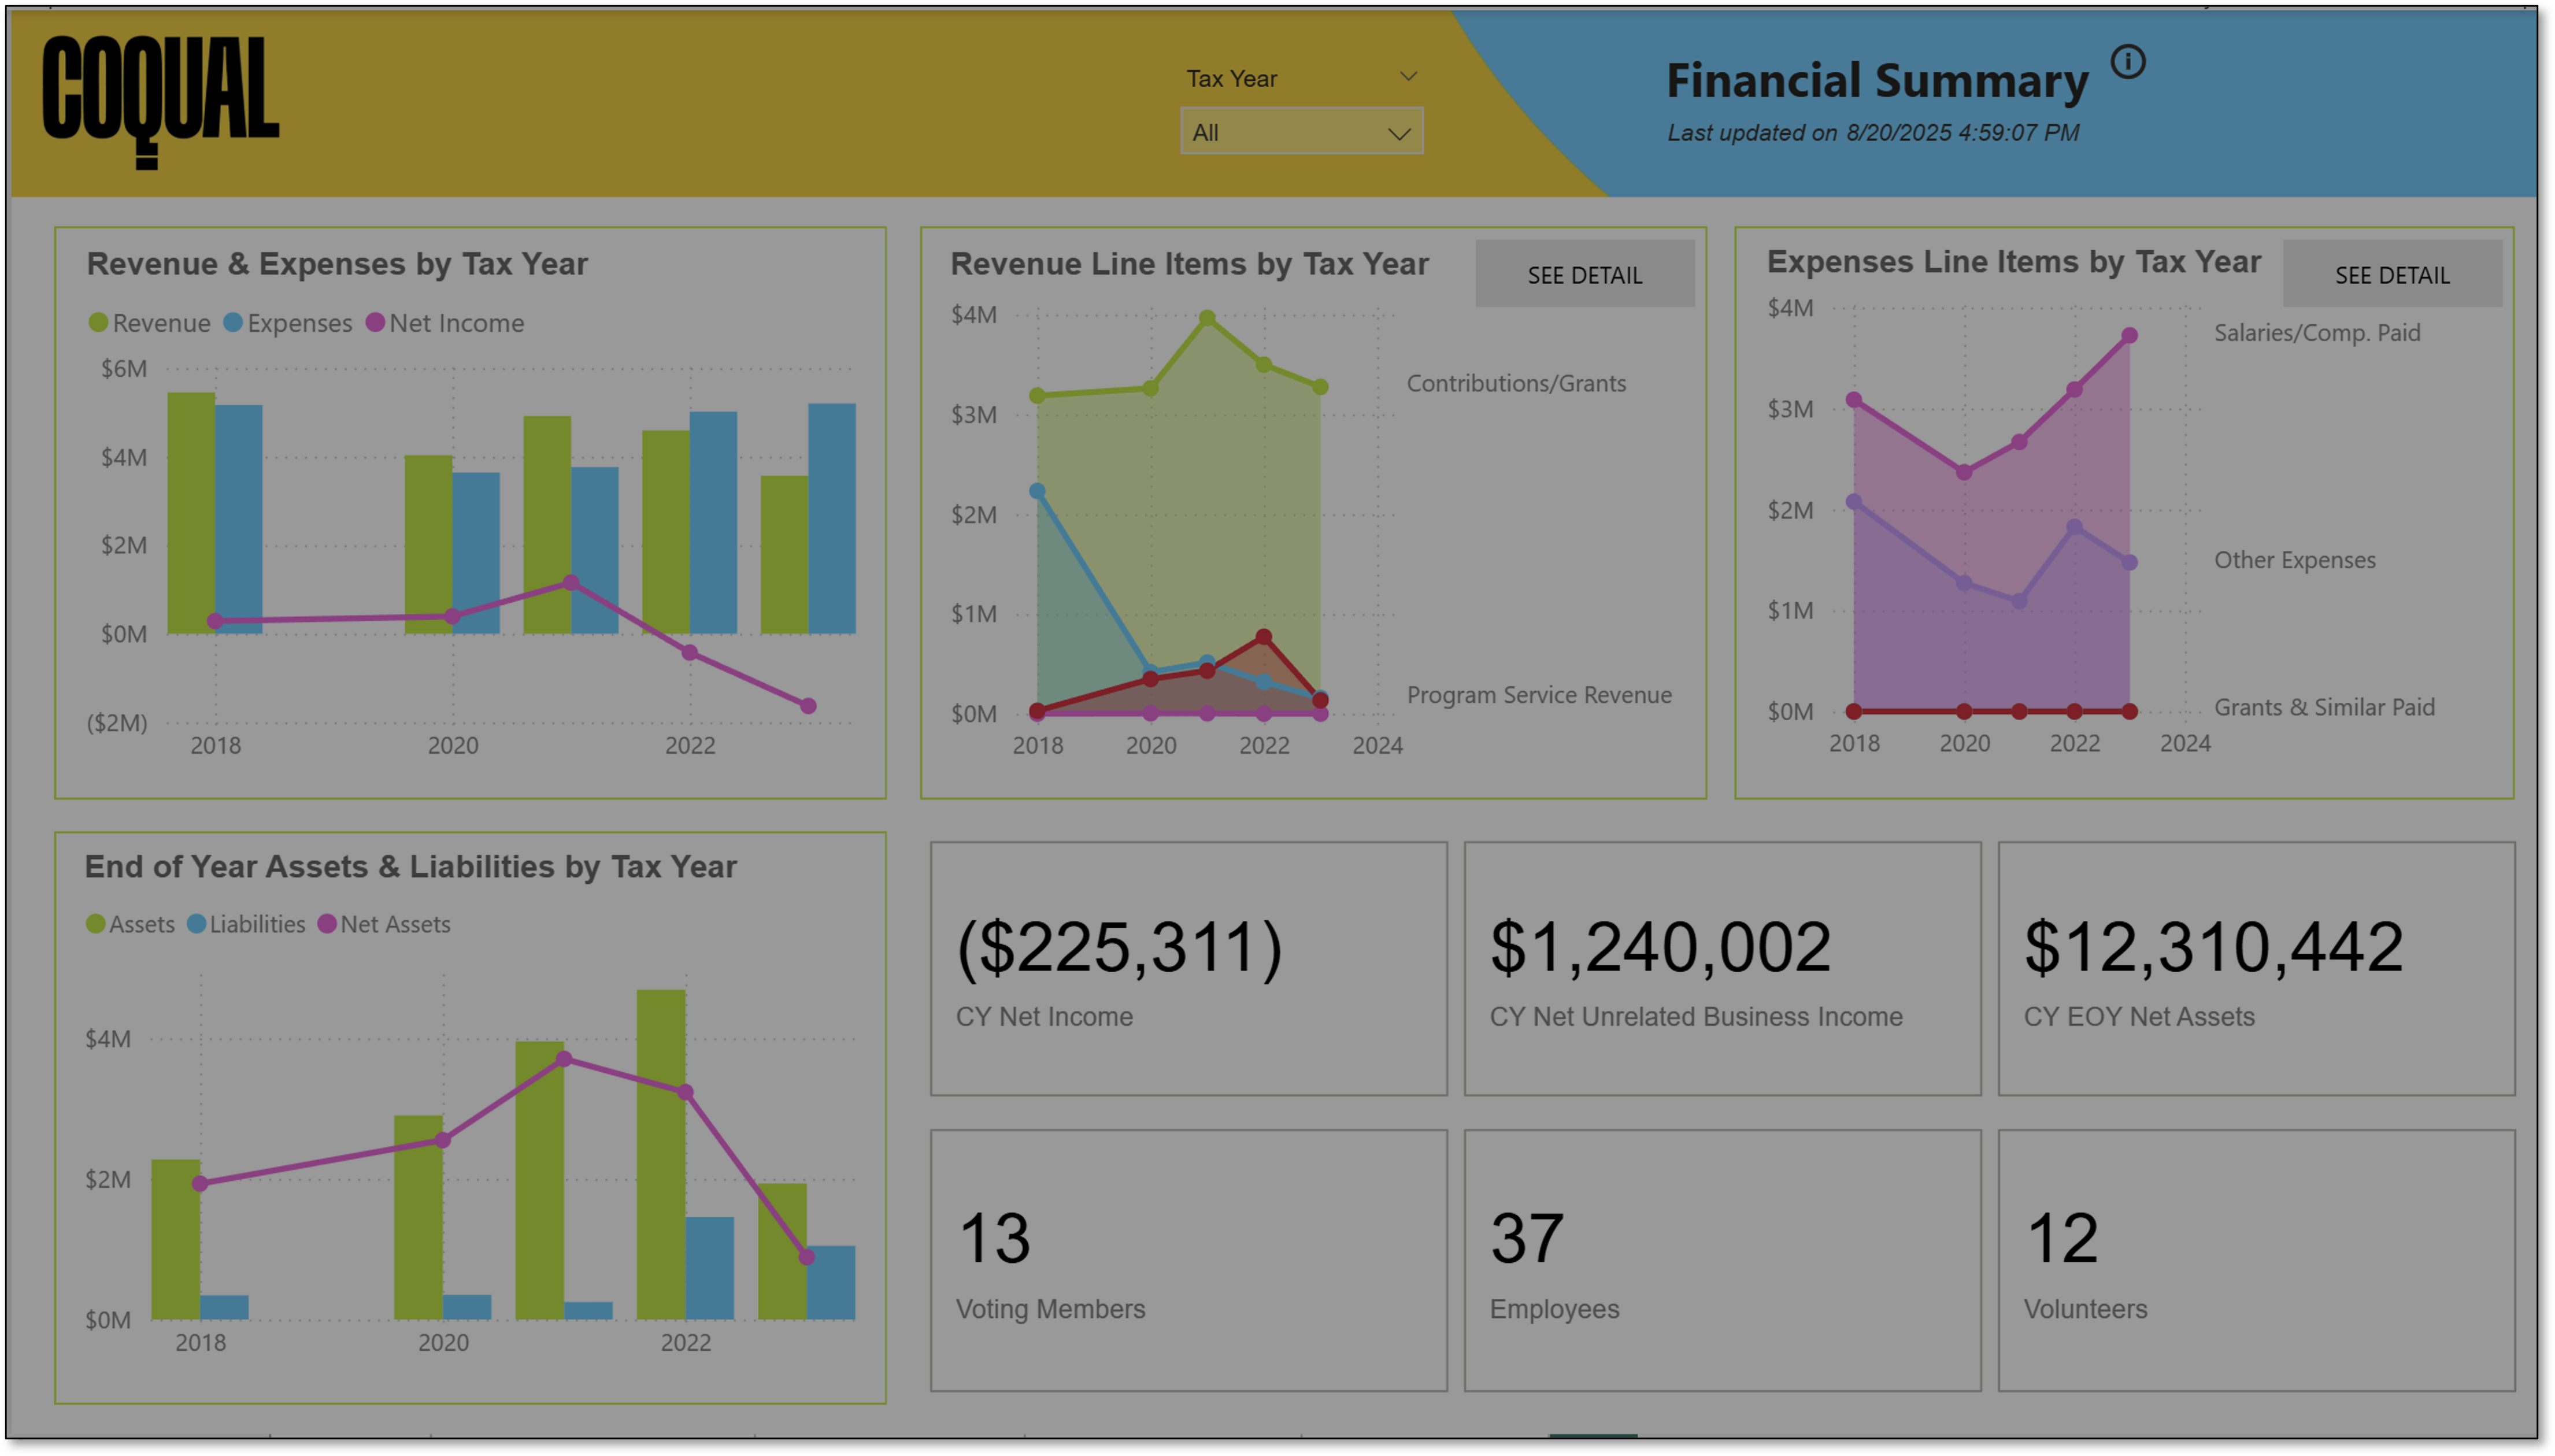
Currently, the dashboard is brought to life using data from Coqual and various other nonprofits, styled carefully to reflect each separate brand identity. This real-world example allows viewers to explore their financial journey and witness the tangible impact they report directly to the IRS, bridging numbers with meaningful mission-driven outcomes.
IRS Form 990 filings are treasure troves of information, yet they remain largely inaccessible to most people who want to understand how nonprofits operate, grow, and serve their communities.
Publicly available financial data on a nonprofit over many years is typically scattered across multiple systems and is formatted inconsistently. This fragmentation made it extremely difficult to obtain a unified view of their financial performance and required manual consolidation that was both time-consuming and error-prone.
Many people lack sophisticated analytical tools to transform data, summarize data or analyze trends.
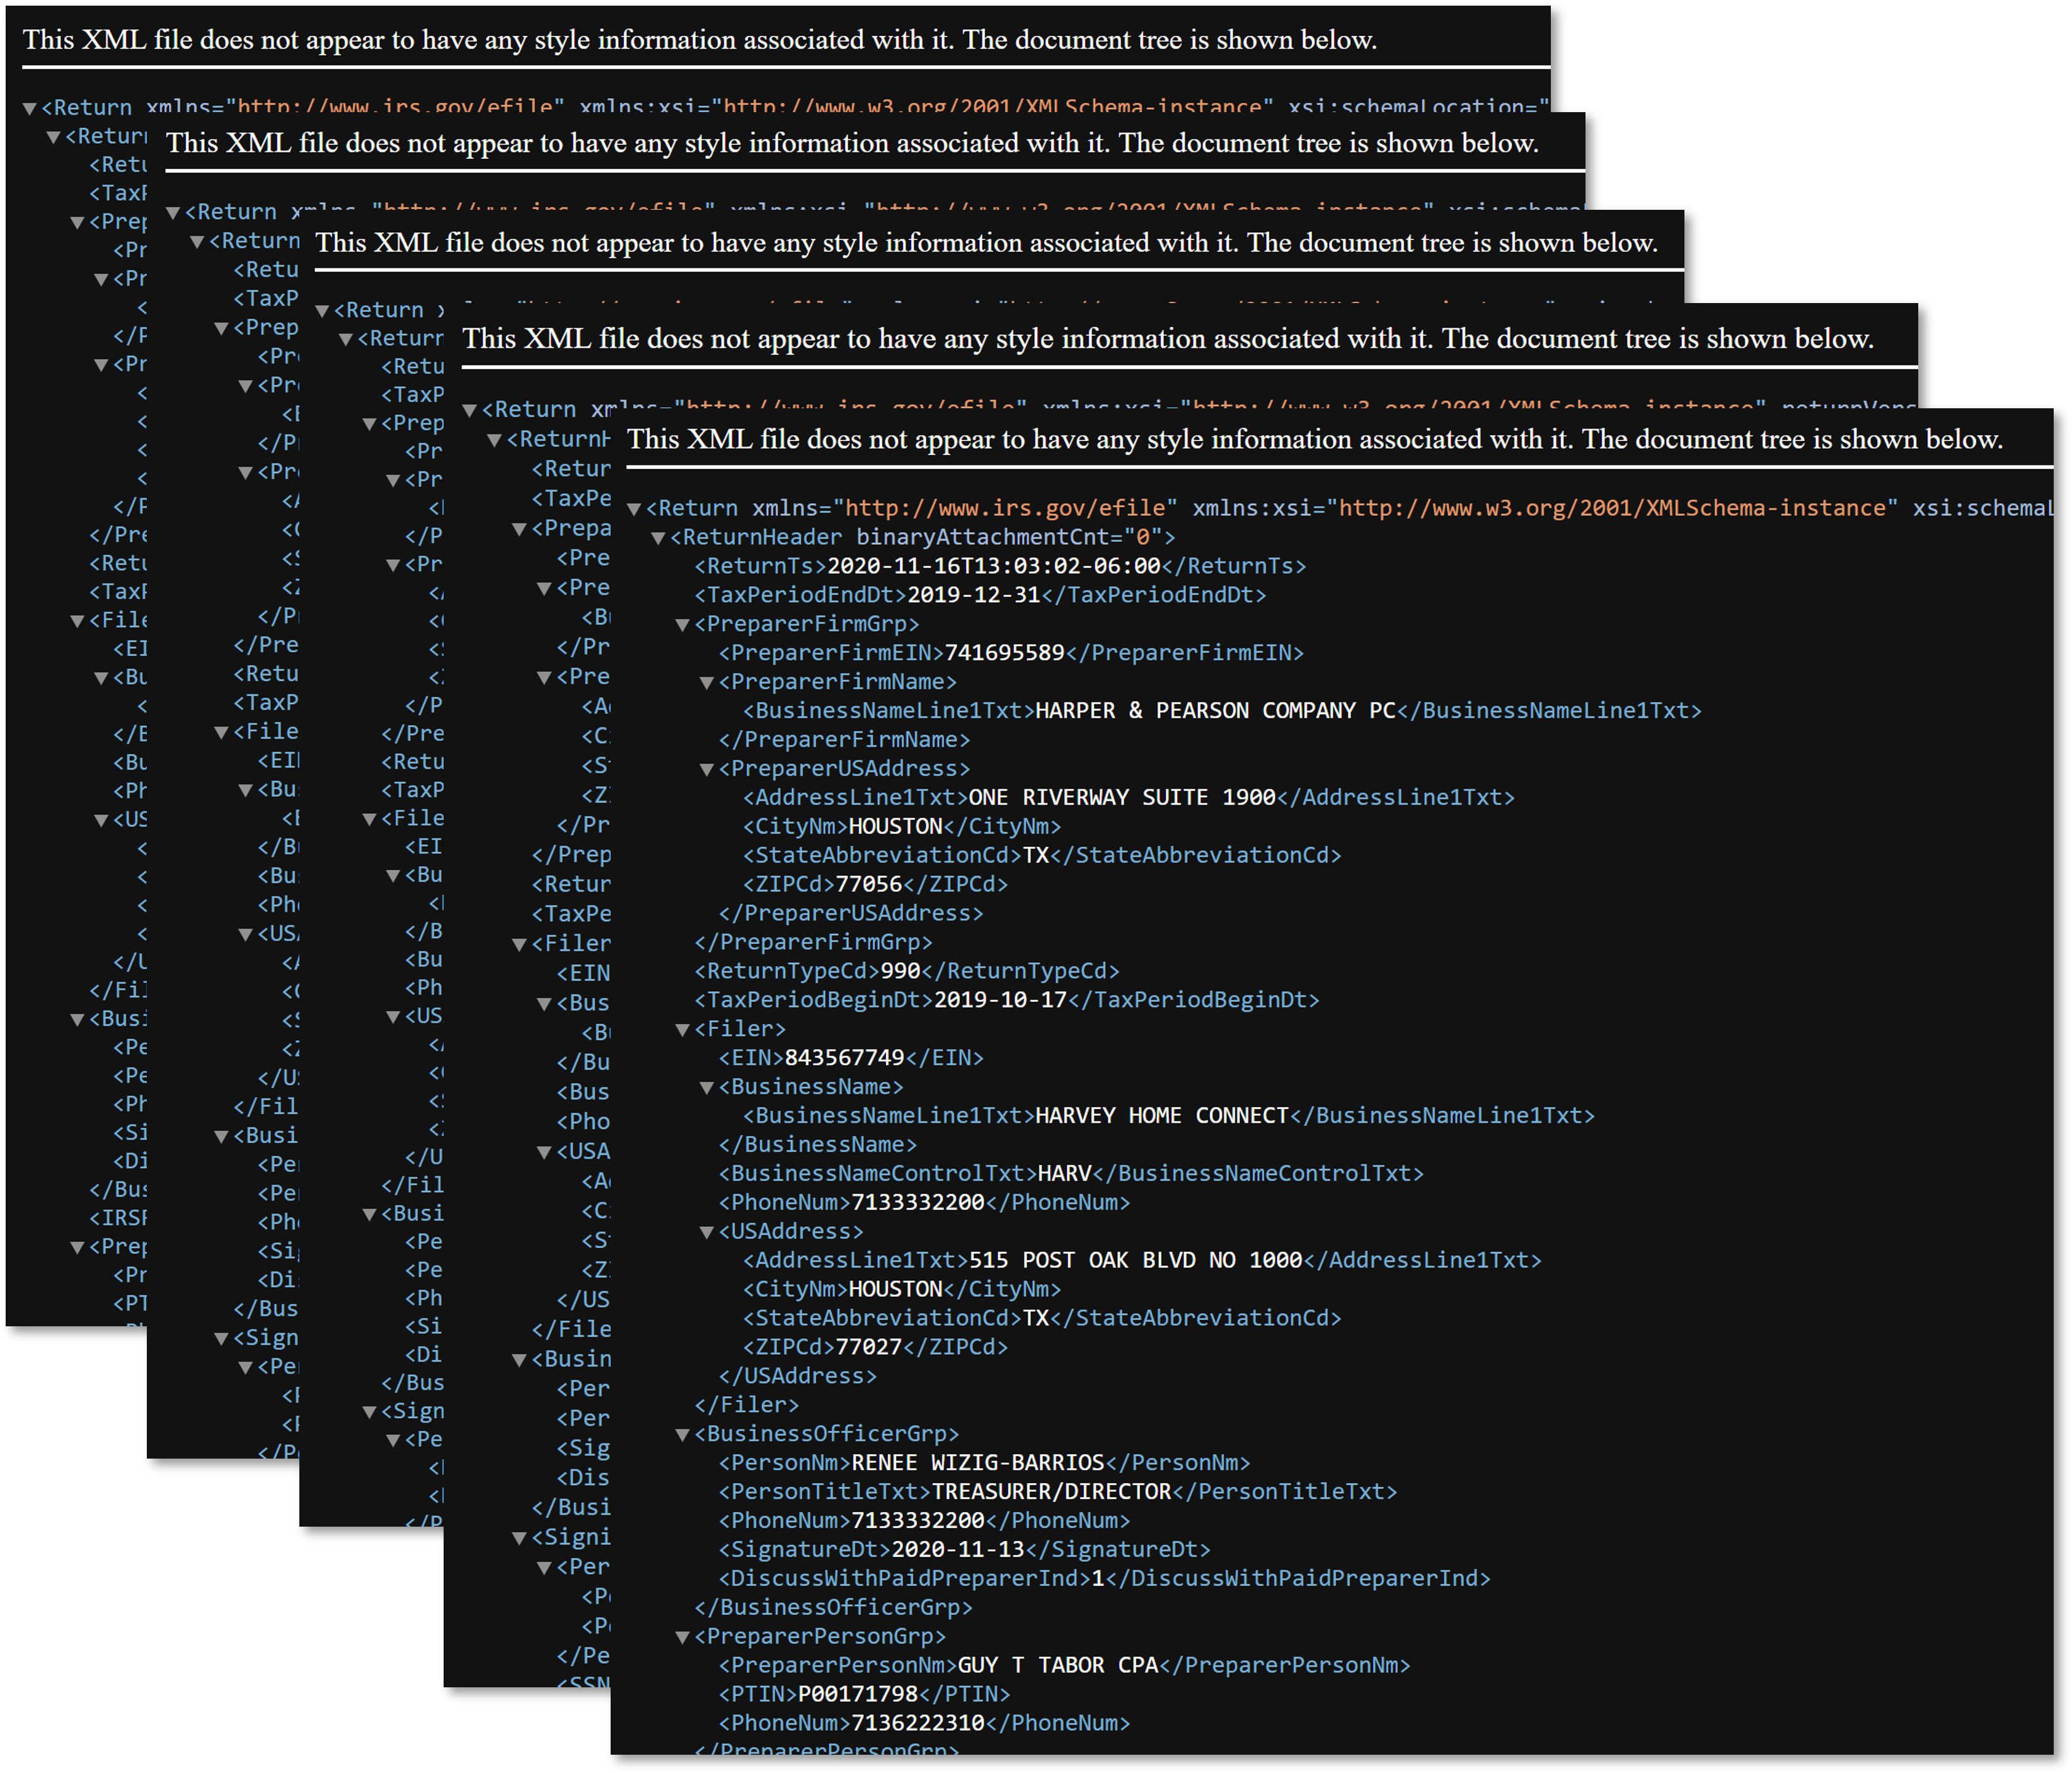
Financial insights were not readily accessible to the average person interested in learning more about a nonprofit organization. Tax filings, whether in form format or the XML format in the image below, are dense and difficult to decipher.

I designed and implemented a high-level dashboard leveraging the standardized formatting of tax return data, transforming a fragmented, manual process into a streamlined process with a much more pleasant user experience.
I developed a streamlined transform and load data process that ingests 990 XML files, applies the same transformations to each and aggregates them together automatically. Thus, this tool isn’t locked to one organization’s data. Instead, it can be easily swapped out to highlight a different nonprofit’s unique story without any technical overhaul.
I designed an intuitive dashboard interface with interactive visualizations that make complex tax return data accessible and actionable. With one glance, users can understand revenue, expense, net income, and net assets trends over time. The dashboard includes a filter by tax return years and a 'Data' page to quickly locate specific data points, if desired.
At its heart, this dashboard acts like a window into any nonprofit’s world — revealing not only their financial trends across revenue, expenses, net income, assets, and liabilities, but also showcasing their mission and powerful program accomplishments all from one place.
IRS Form 990 filings are treasure troves of information, yet they remain largely inaccessible to most people who want to understand how nonprofits operate, grow, and serve their communities. By turning raw XML data into intuitive visuals and concise summaries, this project lowers the barrier to nonprofit financial literacy and impact awareness. Whether you’re a donor, grant-maker, nonprofit leader, or researcher, this dashboard offers a fast, clear way to get the big picture—helping you make informed decisions and appreciate the scale of nonprofit work.
Real-World Uses:
Experience the full functionality of this dashboard in an interactive demo on Power BI.
Open in Power BIDemo version with Coqual data
Let's discuss how I can help you develop a custom analytics dashboard tailored to your organization's needs.
Contact MeInterested in discussing this project or how I can help with your data analytics needs? Send me a message!