Project Management Dashboard
A dynamic Excel-based dashboard that transforms raw project data into instant, actionable insights.

A dynamic Excel-based dashboard that transforms raw project data into instant, actionable insights.
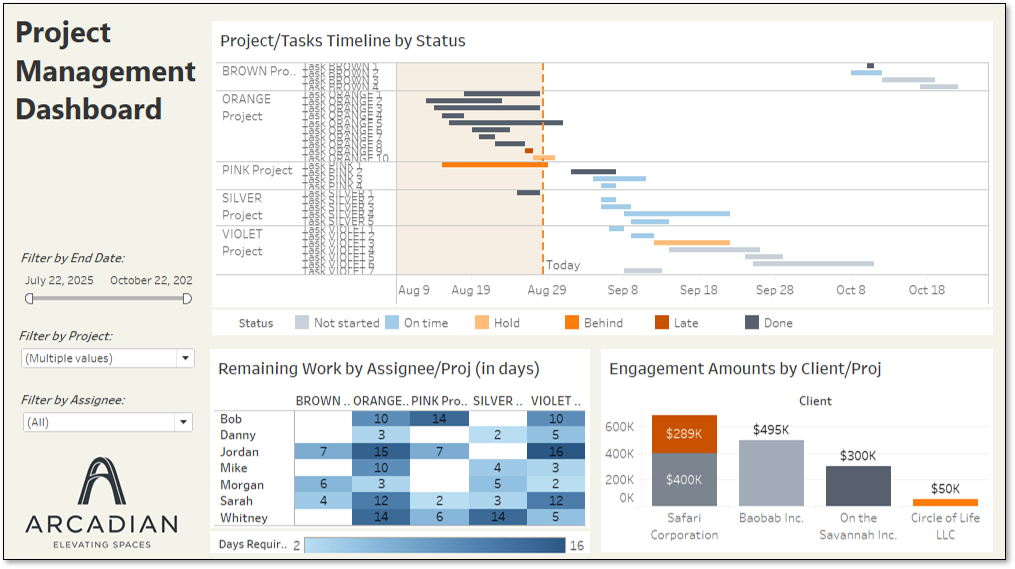
I designed and built an interactive project management dashboard in Excel to make tracking projects and tasks faster and more intuitive. Instead of combing through flat tables, users can now see timelines, workloads, and risks at a glance through visually engaging charts and filters.
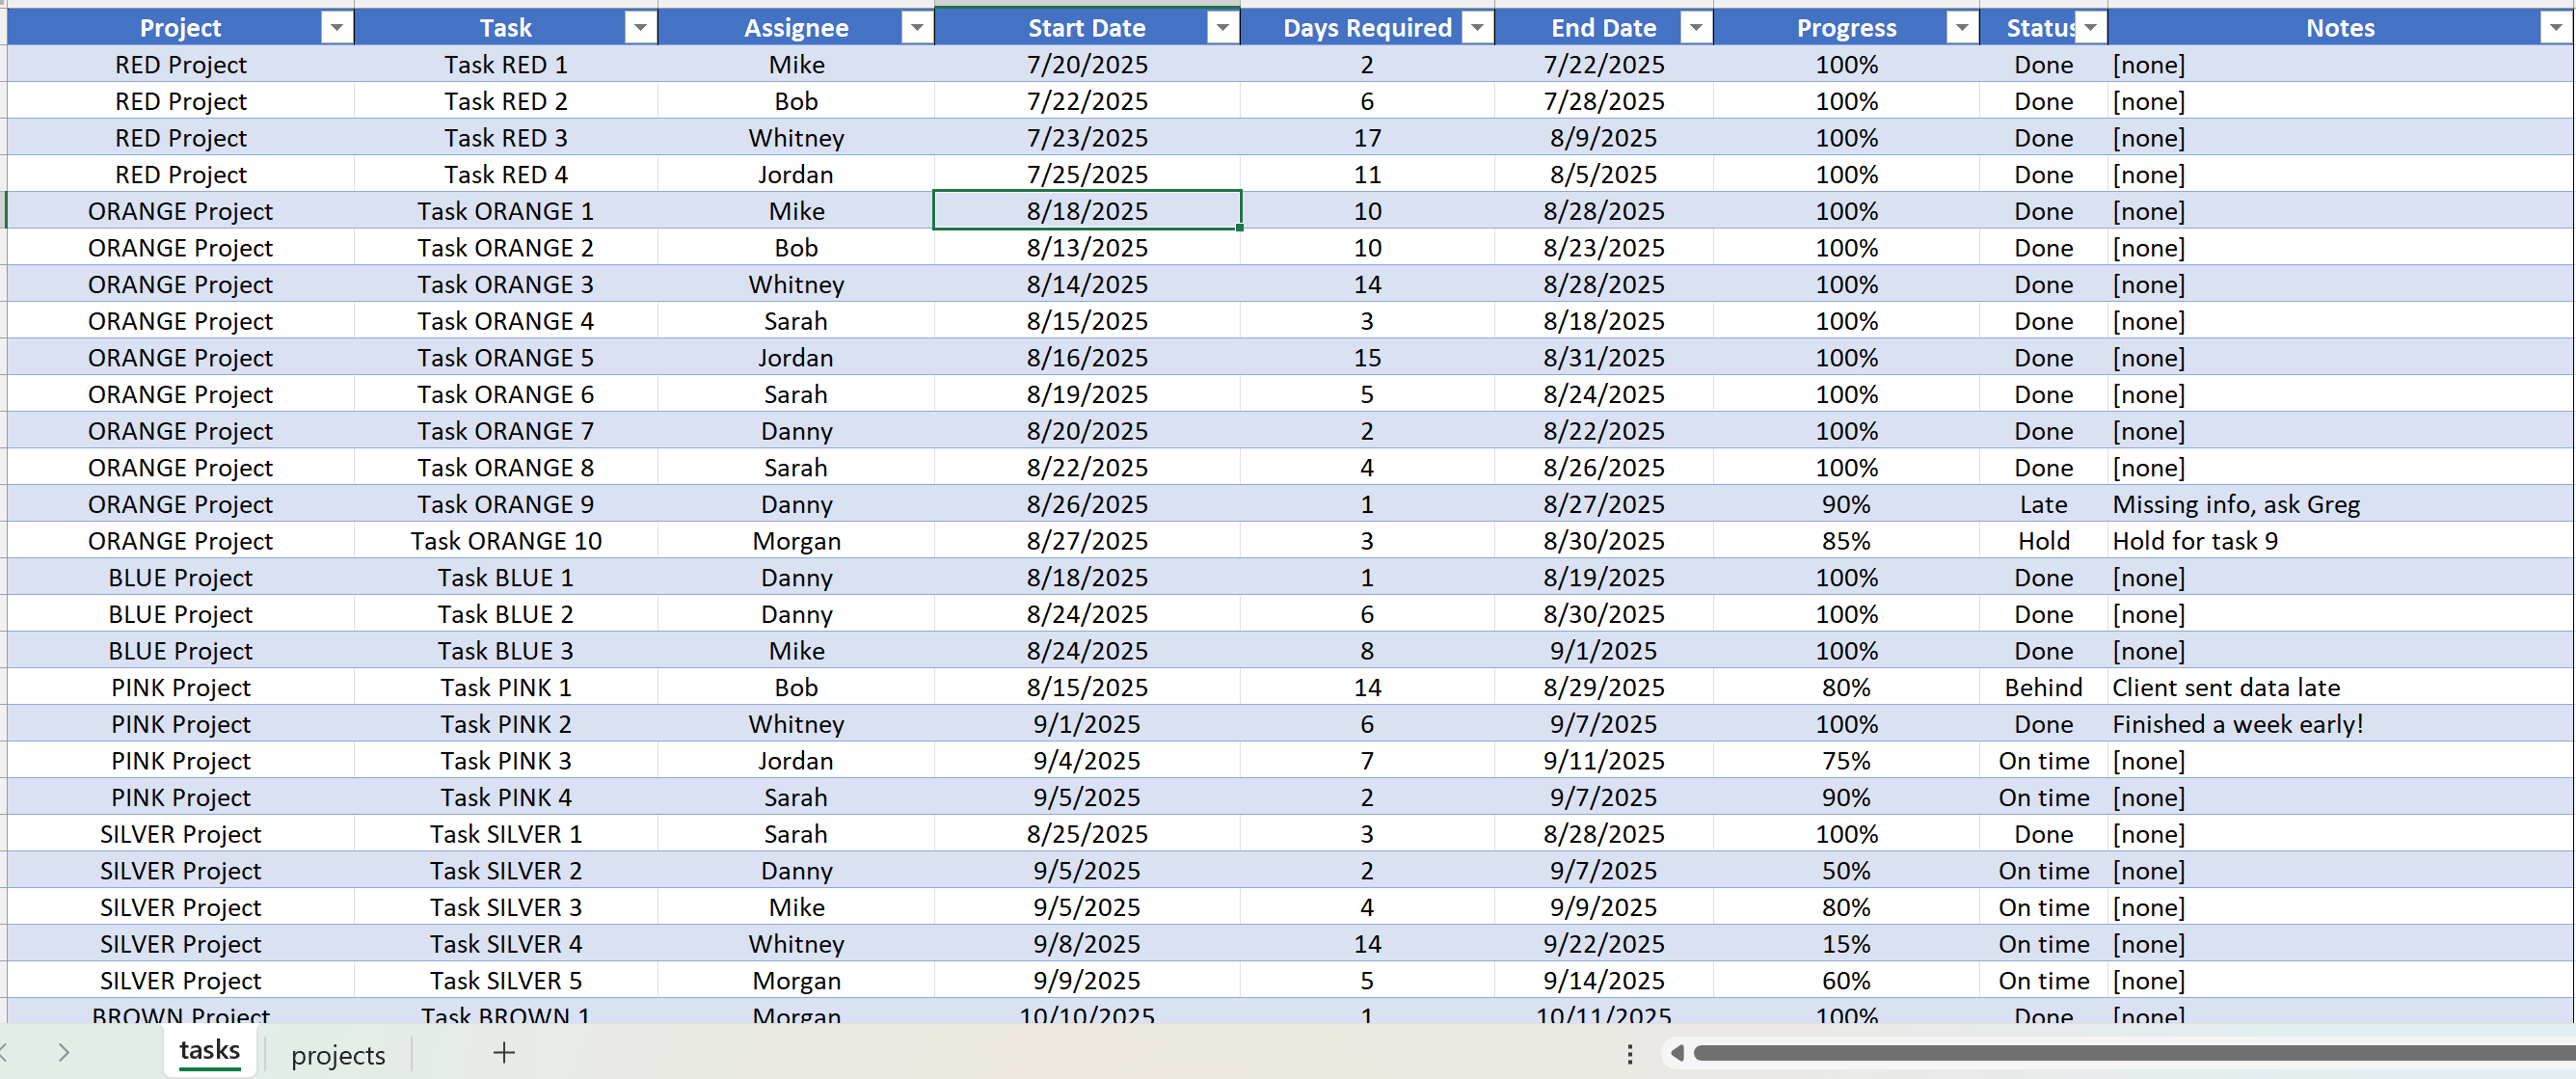
Project and task data were structured as flat tables, making it difficult to quickly assess progress, identify bottlenecks, or understand workload distribution. Traditional reporting formats placed too much emphasis on manual review, rather than quick insights.


I developed a custom Gantt chart with status-based color coding to spotlight overdue or at-risk tasks. A heatmap view highlights workload balance across projects and team members, with hover-over details for remaining tasks. To connect the data to business value, I added a revenue-at-risk view per project. Interactivity and filtering allow users to drill down directly from visual elements, making exploration seamless.
I designed an intuitive dashboard interface with interactive visualizations that make complex tax return data accessible and actionable. The dashboard includes a filter by tax return years.
At its heart, this dashboard acts like a window into any nonprofit’s world — revealing not only their financial trends across revenue, expenses, net income, assets, and liabilities, but also showcasing their mission and powerful program accomplishments all from one place.
The dashboard is endlessly adabtable to any multi-project environment as it enables stakeholders to grasp project health within seconds. Instead of digging through complex tables, they can focus immediately on red or orange tasks and high-risk projects. This tool not only saves time but also helps surface risks earlier, supports better workload distribution, and improves decision-making.
Real-World Uses:
Experience the full functionality of this dashboard in an interactive demo on Tableau.
Open in TableauLet's discuss how I can help you develop a custom project management dashboard tailored to your organization's needs.
Contact MeInterested in discussing this project or how I can help with your data analytics needs? Send me a message!